How can data drive continuous improvement for the benefit of student learning? As I'm typing this, I'm a few hours away from the start of my sixth year of teaching. We implemented the Professional Learning Community (PLC) model about 4 years ago and there has been constant modifications to this model throughout the years as we were told would happen prior to the implementation. One of the aspects I truly love about the PLC model is the data analysis. As a whole, K-5, we are given student scores at the beginning of each year. We receive CELDT scores for English Language Learners, STAR testing results, etc. These scores or data drive our focus and instruction every year. Just as an example, if our language arts scores were low the prior year, we need to focus more on language arts this coming school year. Therefore, our PLC teams would be given that task and move forward based on the needs of our students at every grade level.
As a second grade teacher, I get together every Wednesday with my second grade level team and we go over the data we've collected. Since we will be starting the school year tomorrow, the first two weeks will consist of beginning of the year testing, aka pre-assessments. Every second grade teacher will give the same assessments to their set of students. These common assessments make the process easier when comparing as we're comparing oranges to oranges and not apples to oranges. After we assess our students, we grade the assessments as a team just in case any questions arise that we did not forecast beforehand. In second grade, grading can sometimes be subjective so it helps to talk to each other as we grade. After we grade them, we can no analyze which skill we need to focus on, which skill did most second graders struggle with? At this time we come up with a plan, we share teaching strategies, we group students based on ability levels, etc. In other words, the data will drive us toward a plan of continuous improvement. "Effective schools use information that is available to them to continuously improve." (Ward, Loc 18.) I love meeting with my teammates because everyone is willing to do what is best for our students as a whole, not just in our class but as a grade level and/or school.
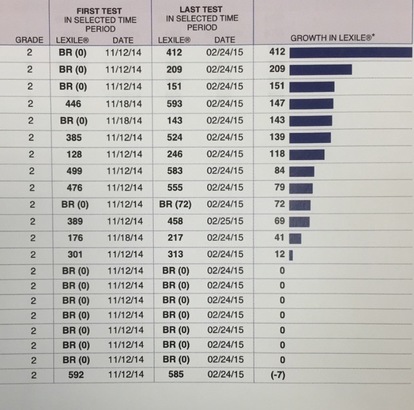
My favorite part of the data collection process, it's actually an addiction, is seeing the beginning of the year data and then comparing it to the end of the year data. It's so mind blowing how much kids can improve in such a short period of time. I love showing this data to the students as well, it gives them a feeling of success, a proud feeling and a feeling that they can accomplish anything with hard work and focus.
References:
Ward, C., Fisher, D., Frey, N., & Lapp, D. (2013). Using data to focus instructional improvement. Alexandria, VA: ASCD
As a second grade teacher, I get together every Wednesday with my second grade level team and we go over the data we've collected. Since we will be starting the school year tomorrow, the first two weeks will consist of beginning of the year testing, aka pre-assessments. Every second grade teacher will give the same assessments to their set of students. These common assessments make the process easier when comparing as we're comparing oranges to oranges and not apples to oranges. After we assess our students, we grade the assessments as a team just in case any questions arise that we did not forecast beforehand. In second grade, grading can sometimes be subjective so it helps to talk to each other as we grade. After we grade them, we can no analyze which skill we need to focus on, which skill did most second graders struggle with? At this time we come up with a plan, we share teaching strategies, we group students based on ability levels, etc. In other words, the data will drive us toward a plan of continuous improvement. "Effective schools use information that is available to them to continuously improve." (Ward, Loc 18.) I love meeting with my teammates because everyone is willing to do what is best for our students as a whole, not just in our class but as a grade level and/or school.
My favorite part of the data collection process, it's actually an addiction, is seeing the beginning of the year data and then comparing it to the end of the year data. It's so mind blowing how much kids can improve in such a short period of time. I love showing this data to the students as well, it gives them a feeling of success, a proud feeling and a feeling that they can accomplish anything with hard work and focus.
References:
Ward, C., Fisher, D., Frey, N., & Lapp, D. (2013). Using data to focus instructional improvement. Alexandria, VA: ASCD
 RSS Feed
